The budget software offers various charts and reports. Information is presented in numerical and graphical form.
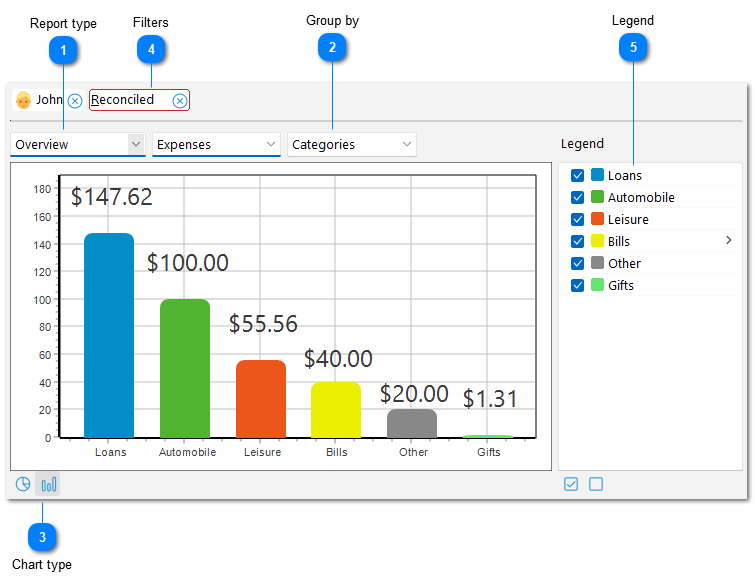
 Report type
-
Overview - summary for the selected period divided by categories, family members, etc. Pie chart or bar chart. -
Trend. Charts: line, bar or area chart.
|
|
 Group by
Group data by income and expense, categories, family members, payee and projects.
|
|
 Chart type
. Pie chart or bar chart for summary and line, bar or area chart for trends.
|
|
 Filters
|
|
 Legend
Double-click the name of any category to view a report about its subcategories. You can select only those items that you want to see on the chart.
|
|
 Русский
 Español
 Português
 Italiano
 Deutsch
 Français
 English